COMP 325 Lecture 12: Object Oriented Analysis: System Dynamics
major resources: Introduction to Object Oriented Analysis, Brown 2002,
Object-Oriented and Classical Software Engineering 6ed,
Schach 2005, Object-Oriented Software Engineering, Schach 2008.
[ previous
| schedule
| next
]
Modeling System Dynamics
- Any object that is created and later deleted has a life cycle (born-lives-dies).
- So far we have focused on static aspects of an object, now turn to dynamics
(what happens over time)
- object diagram includes only static aspects of the system
- dynamics are modeled in UML using
- statechart diagrams
- collaboration diagrams
- sequence diagrams
- In Schach OOA, this addresses dynamic modeling and use-case realization
- In Brown OOA, this addresses KRB Step 7 find behaviors
UML Statechart diagrams
- Any object that has attributes has state (set of attribute values).
- Any object having behaviors/associations which change its attributes can
undergo state transitions.
- State transition occurs when object state changes
- State transitions are triggered by events.
- Many object state transitions are of interest for analysis modeling - in
particular, those that model changes of state that user's-world object goes
through. Others occur but are not yet of interest.
- Statechart diagrams (similar to state transition diagrams or finite
state machines) are included in UML to model life cycles and state transitions.
- class should probably have a statechart diagram if it has an
operational life cycle (pattern repeated many times throughout life,
such as states of a library book: shelved -> checked out -> checked
in -> shelved).
- What kinds of things are relevant to the "experience" of changing
state?
- the source state, or state before the transition
- the target state, or state after the transition
- the event trigger, or event that directly causes the transition
- the guard condition, an optional condition that must be true
at the time event is received for the transition to occur
- the transition action, an optional and atomic operation carried
out "during" the transition
- Some Examples
- Operation of an elevator
- consider single elevator system, such as in Towers Hall
- what states does it have?
- what events cause state transitions, and from what to what?
- what events (if any) do not cause state transition?
- develop a UML statechart diagram
- note that this is an operational cycle, not a life cycle
- Operation of a credit-card gasoline pump
- Operation of an ATM machine (consider 3 classes: customer, machine, account DB)
- Basic symbols (from
http://www.smartdraw.com/tutorials/software-uml/uml5.htm):
| state |
 |
event-driven transition |
 |
| initial state |
 |
final state |
 |

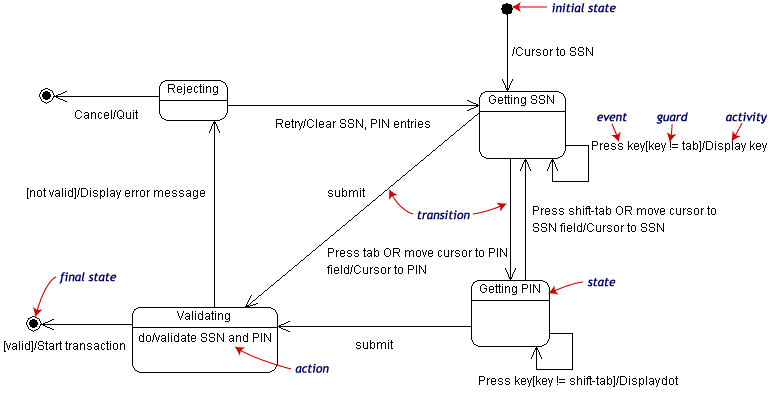
Statechart Diagram for Logging into online banking service
UML Collaboration diagrams
- Class diagrams and statecharts do not accurately model execution sequences
- a CRC card models associations and collaborations with other classes from
the viewpoint of one class but not dynamics
- a class diagram models associations among all classes in the diagram but
not dynamics
- a statechart models class and object dynamics (not associations), but only
partially models sequence
- the UML tools to model sequence are collaboration diagrams
and sequence diagram
- Collaboration diagram is comparable in power to sequence diagram (see below) for illustrating dynamics,
except sequence must be made explicit by numbering arrows.
- Basic symbols (from
http://www.smartdraw.com/tutorials/software-uml/uml5.htm):
Object and/or class
(do not include attributes)
can use stereotype figure or stick person |
 |
message passing (method invocation)
include sequence number
optional condition in [ ] |
 |
| Association between classes |
 |

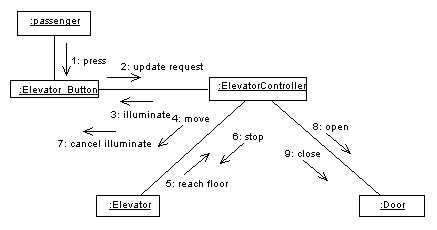
Collaboration Diagram for Elevator Button
UML Sequence diagrams
- What a sequence diagram shows
- diagram represents an execution sequence from the viewpoint of one class
- can be developed during use-case role playing exercise (at same time as
CRC cards are developed)
- viewpoint is typically that of a "client" class which requests things from
other classes
- a 2-dimensional chart
- leftmost "column" is client class
- other "columns" represent classes that it interacts with
- each "row" represents an interaction (event, message, response)
- rows are time ordered from top (first interaction) to bottom (last interaction)
-- relative length of time is not modeled
- To see examples of sequence diagrams on the web, search for "uml sequence
diagram"
- See http://www.agilemodeling.com/style/sequenceDiagram.htm for some examples
Object and/or class
(do not include attributes) |
 |
Actor (other stereotype
figures can be used) |
 |
Object lifeline
(starts when created) |
 |
Active section of timeline |
 |
Object destruction
(X at lifeline bottom) |
 |
message passing
(method invocation) |
 |

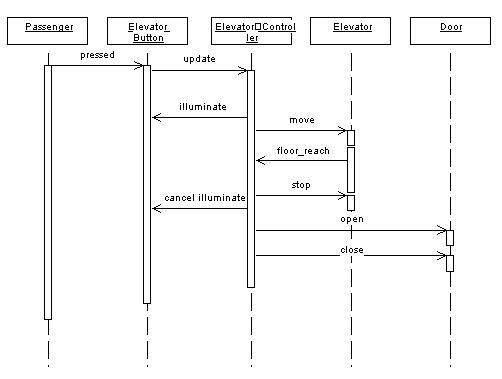
Sequence Diagram for Elevator Button
[ COMP 325
| Peter Sanderson
| Math Sciences server
| Math Sciences home page
| Otterbein
]
Last updated:
Peter Sanderson (PSanderson@otterbein.edu)


