COMP 1600 Project 1: The Road to Health
30 points
Deadline: beginning of Lab February 20
This is an individual assignment
Your Assignment
Your applet will request several pieces of information from the user and then
produce a color-coded heart rate bar chart for a 50-minute workout. Here is a summary.
- I will provide you folder Project1, which contains an applet, HeartRate.java.
You will find it on the "I: drive", available in the Towers computer lab. Use Windows Explorer to follow
the I: drive, then COMP, then 1600, then 20142-COMP-1600-01 then Common. Copy
folder Project1 into your Z: drive workspace, preferably into a folder you've created for your COMP 1600 work.
- In jGRASP, open HeartRate.java. Compile and run it to make
sure it works. You will modify this class to build your solution.
- What your program will do (short version):Request the user's name,
age, and resting heart rate. Calculate training zone minimum and maximum heart
rates based on the formulas given below, then produce a color 5-segment horizontal
bar chart to represent ideal heart rates to maintain over a 50 minute workout.
This can all be done by modifying the class provided.
- Submit the resulting HeartRate.java program.
The main purpose of this assignment is to give you experience using a number of different classes from
the Java API. Most of these you have already seen in the textbook Chapter 2 examples. Others are introduced as needed. You need to use the Java API web site
to get information on the classes and methods you will be using. Its URL is:
http://docs.oracle.com/javase/6/docs/api/
The Calculations
The effectiveness of an aerobic training program can be measured by
heart rate during training using the Karvonen formula. According to the Karvonen formula, a person's aerobic workout should
be designed to maintain a heart rate within a Training Zone.
- The person's Age is input by the user
- The person's Resting Heart Rate is input by the user
- The Maximum Heart Rate is calculated by: 220 - Age
- The Heart Rate Reserve is calculated by: Maximum
Heart Rate - Resting Heart Rate
- The Training Zone low end is calculated by:
(Heart Rate Reserve * 0.50) + Resting Heart Rate
- The Training Zone high end is calculated by:
(Heart Rate Reserve * 0.85) + Resting Heart Rate
Example: a 48 year old person with a Resting Heart Rate of 60 BPM
(beats per minute).
Maximum Heart Rate = 220 - 48 = 172
Heart Rate Reserve = 172 - 60 = 112
Training Zone low end = (112 * 0.50) + 60 = 116
Training Zone high end = (112 * 0.85) + 60 = 155
Everything is rounded to the nearest whole number. Hint: use Math.round()
What Your Program Will Do (Details)
Program execution has three major phases: get the input, perform the
calculations, and draw the results.
Phase 1: get the input
- Input will be performed within the void init() method. This method is called
automatically when your applet is run.
- Use JOptionPane to get the user's name, age and resting heart rate. The dialog box will be
centered on the screen. The first one is done for you.
- Store these in the String variables provided.
- For use in calculations, the age and resting heart rate need to be in integer variables. You can get
an int from a String by using the Integer.parseInt() method. Give it the string
variable as an argument and it will return the corresponding int value. You will assign the return value
to the provided int variable.
- Also, be sure to put your name in the program, as a comment at the top of the file.
Phase 2: perform the calculations
- The heart rate calculations can be performed inside the paint() method.
- Use the integer age and resting heart rate to calculate the various heart rates described in the Karvonen
formulas. For debugging purposes, I suggest you output the results using System.out.println(), so you
can view them in jGRASP's output window at the bottom of the screen. If you do this, be sure to remove or
comment it out before submitting the program.
- Determine the target heart rates for a 50 minute workout, in five 10-minute
segments. The
target heart rate for the first segment should be at the lower end of the training zone. The second
segment should be at the midpoint between the lower and upper ends of the
training zone. The third segment should be at the upper end of
the training zone. The fourth segment should be the same as the second and the fifth the
same as the first.
Phase 3: draw the results
- Graph the results on the Graphics object page you are already
given in the paint() method.
Graph the 50 minute workout as a horizontal bar chart (left edge is the base).
Each 10-minute segment will be a rectangle, and the target heart rate determines
the width of the rectangle. The five rectangles will be of equal height (you
choose the height; each represents 10 minutes) and will be adjacent to each
other with time going from top to bottom. The color of the rectangle will
be determined by the target heart rate level. Since there are 3 different
levels (low end, midpoint, high end), use three different colors of your choice.
Each segment should be labeled with the target heart rate it represents - you can
put the label to the left of or inside the rectangle.
- Beneath the chart, put the label "Workout chart for name age age".
Output the age as input by the user (the String variable).
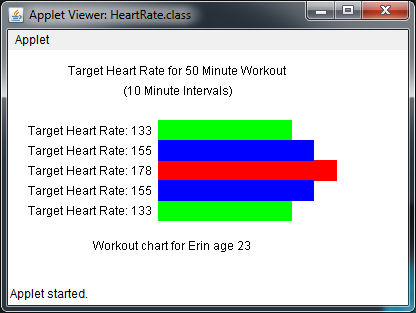
Example Result
Here's an example chart for Erin, age 23 with resting heartrate of 68 bpm.
Point Allocations
| Points | Item |
|---|
| 10 |
Phase 1 to get the inputs, score them into string variables, and get the
integer equivalents for the age and resting heart rate. This also includes
putting your name into the program as a comment! |
| 10 |
Phase 2 to perform the calculations. This includes correct formulas and
use of descriptive variable names. |
| 10 |
Phase 3 to draw the results. Partial credit depends on how many elements are drawn. |
To Turn In
When you are finished, place HeartRate.java into your individual DropBox folder. This is on the I:
drive. Browse to I:\COMP\1600\20142-COMP-1600-01\DropBox then drop the file into the folder with your name.
[ COMP 1600
| COMP 1600 Projects
| Peter Sanderson
| Math Sciences home page
| Otterbein ]
Last updated:
Peter Sanderson (PSanderson@otterbein.edu)