Final
Report
SAIL
III
Diane
Ross, Ph.D.
Project
Director
Niki Fayne, Ph.D.
Internal
Evaluator
July 30, 2005
Context
Project SAIL (Summer Academy for Integrated Learning) is a direct result of a collaboration among Columbus Public Schools, Otterbein College and Project GRAD Columbus. Over the past three years, SAIL has provided professional development for 26 teachers in GRAD middle schools, field experiences for 39 Otterbein students, and a special summer program for over 200 middle school students from the GRAD schools.
SAIL was designed to address the following three goals: (1) to provide professional development for teachers in GRAD middle schools; (2) to establish an urban field experience for Otterbein Middle Childhood Teacher Education candidates that focused on current middle school practices; and (3) to expose middle school students to curriculum and instruction that is academically challenging, developmentally responsive and socially equitable. These goals are interdependent; in order for one goal to be met, all goals must be met.
SAIL is divided into three interconnected stages:
· Stage One introduces best practices and allows participants to develop a shared set of understandings and a common vocabulary. Selected teachers in GRAD middle schools take two graduate courses focusing on middle school philosophy, curriculum and instruction. At the same time the Otterbein students are also taking their middle school methods classes. The students are paired with one of the teachers in the project for their field experience.
· Stage Two provides both the teachers and the college students an opportunity to put what they have learned into action by creating and teaching in a three week summer middle school academy with middle school students from GRAD middle schools. Curriculum for the academy is developed using a “Backwards Design” approach created by Grant Wiggins, a leading authority on curriculum and assessment. This approach requires that teachers first identify “essential understandings” (i.e., what students are supposed to learn); secondly, they are to align these understandings with specific Ohio Academic Content standards (and Columbus GLI’s). Third, teachers must spell out what performances (tests, projects, portfolios, journals, etc.) will provide evidence that standards have been met. Only after the first three steps have been accomplished do teachers develop activities or lesson plans.
· Stage Three is designed to encourage the teachers to incorporate what they learned and experienced into their school with the support and assistance from the faculty at Otterbein. Follow-up meetings, informal communication, and site visits have been part of this stage.
SAIL
III
SAIL III was designed according to principles of evidence-based teaching. This model ensures that what is taught aligns with standards and promotes student achievement. Both the graduate courses and the three-week session focused on two “big questions”: 1) How can we use the data that we have gathered to make better decisions? and 2) Based on systematic review of data, how can I make changes to improve myself, my behaviors, and my surroundings?
Professional Development for In-Service and Pre-Service Teachers
During Winter Term, 2005, the eight teachers selected for
SAIL III learned about evidence based teaching, traditional and alternative
assessment techniques, qualitative inquiry, and culturally relevant pedagogy
under the direction of Diane Ross, Ph.D., SAIL Project Director and Assistant
Professor of Education at Otterbein College. They
read A Passion for Proof: Using Data to Accelerate Student Achievement in the first of the two
graduate courses. The middle school highlighted in this case
study was selected by the National Forum to Accelerate Middle Grades Reform
"Schools to Watch" as a model of a data- directed school. The
2005 teacher participants learned about “backwards design” by reading and
discussing Grant Wiggins’ Understanding
by Design. They struggled with culturally relevant pedagogy as described in
Geneva Gay's Culturally Responsive Teaching. In addition, they
read a young adult novel, Handbook for Boys by Walter Dean
Myers. The novel highlights issues faced by urban adolescents.
During Spring Term, 2005, the eight teachers participated in
the second graduate course which had teacher leadership and school improvement
as themes. This course was designed as an action-oriented experience
that explored the multiple aspects of the teacher as a leader. Teachers were to
discover their own leadership potential as they delved into the characteristics
of leadership, adult development, the school culture, interpersonal and
technical skills, and task and functions of leadership. Teachers were assigned
an Otterbein College methods student in cases where matches could be made
between teaching assignments and licensure areas. If no match was possible, methods students
were assigned to another teacher in one of the three middle schools from which
the teachers were drawn. The following activities were required in order to
earn graduate credit:
·
Self-reflective journaling: Teachers kept a daily journal of their
interactions with pre-service teachers and their own growth and development.
·
Team meetings: Teachers attended weekly meetings with Otterbein students. They
participated in a book study and discussed topics related to urban education.
·
Otterbein student observations and evaluations: After learning new means of observing and
mentoring pre-service teachers, cooperating teachers "formally"
observed, documented, discussed and synthesized their observations of their
Otterbein student participant.
·
Action research projects: Teachers designed and implemented a school or classroom based action
research project aimed at school improvement.
·
Preparation and implementation of summer plans: Teachers participated on a SAIL
preparation team with Otterbein College pre-service teachers. During planning meetings, team members took
responsibility for specific aspects of the summer program.
Movement of the People:
SAIL III (Summer, 2005)
An overview of the three-week summer program is
provided below:
|
STANDARDS:
(SLC/GLI) |
|
|
1.
Read,
create and interpret box-and-whisker plots, stem-and-leaf plots, and other
types of graphs, when appropriate. 2. Analyze how decisions about graphing
affect the graphical representation; e.g., scale, size of classes in a histogram, number of categories in a
circle graph. 3. Analyze a set of data by using and
comparing combinations of measures of center (mean, mode, median) and measures of spread (range,
quartile, interquartile range), and describe how
the inclusion or exclusion of outliers affects those
measures. 4. Construct opposing arguments based on
analysis of the same data, using different graphical representations. 5. Compare data from two or more samples to
determine how sample selection can influence results. 6. Identify misuses of statistical data in
articles, advertisements, and other media. Physical
Sciences: Forces and Motion 1. Describe how the change in the position (motion) of an
object is always judged and described in comparison to a reference point. 2. Explain
that motion describes the change in the position of an object (characterized
by a speed and direction) as time changes. 3. Explain
that an unbalanced force acting on an object changes that object's speed
and/or direction. |
|
|
ENDURING UNDERSTANDINGS (Big Ideas) Data gathering to make decisions How movement can be affected by the data
that is collected and the application of that data to make changes. |
ESSENTIAL QUESTIONS How can I use data to help me understand the world around me? How can I use
information to be a player and not a poser? How can I use
the data that I have gathered and analyzed to make better decisions? Based on data
that is collected, how could I make changes to better myself, my community,
and my world? How does
movement affect you, your community, and your world? |
KNOWLEDGE SKILLS
|
What is data? How to interpret
data Types of graphs Mean, median,
mode Why use data? When to use
data Drawing
conclusions from data Newton’s laws
of motion Inferences |
Data collection
techniques Graphing:
construction and interpretation Data analysis:
appropriate and inappropriate uses of data Use of
technology to support data collection, analysis Measurement
Making logical
inferences Problem solving |
||||||
ASSESSMENT
EVIDENCE
|
|||||||
STUDENT
PERFORMANCE
Create
and recreate: Bottle Rockets Mousetrap cars Paper airplanes Kites Parachutes Tri-fold
presentation for parents, community
LEARNING EXPERIENCES AND INSTRUCTION |
TESTS/QUIZZES/PROMPTS/
OBSERVATION
Pretest/posttest Graphs and
charts prepared on construction labs, mystery simulation, COSI visit Written
responses to prompts (example: Write a journal entry, witness report, essay
or newspaper article based on data collected during SAIL-Away mystery
simulation) Teacher
observation: approaches used to solve problems |
STUDENT
SELF-ASSESSMENT AND REFLECTION
Daily journal
responses: What did I learn today? Oral Defense of
Presentation: ·
What
is data? ·
How
do you use data? ·
How
do you think data collecting and analysis can affect your world? ·
What
have you learned from SAIL? |
|||||
|
Week One Observation: What is it? Obstacle
Course: Record speed of completion High Ropes/Climbing
Wall: Record what you saw, heard, felt Zoo Birds:
Identify types of birds, wing shapes, flight patterns Pedometers: Keep track of steps taken on a daily basis Forensics:
Blood samples and fingerprints SAIL-Away
Sweets Ice Cream Shop’s Ice Cream Mystery: Simulation |
Week Two Application: How do I use it? Construction
labs Cars Planes Kites Rockets Parachutes Trip to COSI
for Titanic exhibit |
Week
Three Analysis: How does it affect your world? Mr. Baynes, “The Science Guy,” African-American Aviation
Society : aviation and the role of African-Americans in science and discovery Trip to
Otterbein College for final
presentations |
|||||
Evidence
of Program Effectiveness
SAIL III was designed to enhance the academic achievement of urban middle schools students through professional development of pre-service and in-service teachers. Below is a management plan that outlines strategies, performance measures, data collection, baseline and projected outcomes:
|
Activities/Strategies |
Performance Measures |
Data Collection |
Baseline |
Projected Outcomes |
|
1.
Provide professional development based upon proven practices of middle level
education for teachers at Medina, Indianola, and Crestview Schools. |
1. 8 In-service Teachers:
a) complete 2 graduate-level courses b) teach in Summer
Academy using new teaching strategies. c)
supervise pre-service teachers in an urban setting. |
1a. Curriculum review and course logs. 1b Student surveys and dispositional
assessment. 1c Teacher survey and retention data. 1d.
Principal Interviews. |
1. Current middle school curriculum is in need
of improvement. Teaching practices are
not culturally or developmentally responsive.
Teacher retention is low and over school climates continue to
challenge the school systems. |
1a.
Proven practices in middle level education are incorporated throughout the
participating schools. b.
Teaching practices are developmentally responsive to young adolescents. c. Teachers’ satisfaction and retention improves. d. The overall school climate
and academic achievement improves. |
|
2.
Expose middle school students to evidence-based teaching strategies that
improve attitudes toward learning and enhance academic achievement. |
2a. 80 students will be
recruited for Summer Academy. b. Orient parents and
students. c. Students attend Summer
Academy d. Parents attend finale
celebration event. |
2a.Participation
logs. Student surveys. 2b. CPS academic
achievement data. |
2. Participating schools are on academic
watch. Students at the middle schools
are not meeting Ohio passage rates in any of the five proficiency areas. |
2a. 60% of the students
will improve their attitude toward learning. b. 60% of the students will
increase their academic achievement. |
|
3.
Develop urban field experiences for pre-service teachers consistent with
proven practices in middle level education to increase their urban
employment. |
3.
Eight Pre-service teachers: a) assist teaching Summer
Academy; b) incorporate what they
have been taught in their methods classes; c) engage in a reflective
process with the supervising middle
school teachers. |
3a. Site visits and student assessments.
3b. Pre-service student
surveys. |
3.
Pre-service teachers are undecided about choice of setting. Formal middle-school pedagogical training
at current sites is lacking.
|
3a. Schools are effective field sites for
pre-service middle school teachers.
b. At least 40% of the pre-service teachers will choose employment
in urban setting.
|
|
4. Fund future professional
development. |
4a. Participating teachers
disseminate project findings and lessons nationally and locally. b. Submit Teacher Quality
Enhancement federal 5 yr. proposal. c. Submit GEAR-UP federal
proposal. |
4a. Review of
dissemination of project results. 4b-c. Funding is
monitored. |
4. Current funding levels include private
funding for action research projects and SBC.
|
Future funding is obtained
to have broader impact within schools and to train SAIL mentors to continue
program post-funding. |
Strategy One:
Provide professional development based upon proven practices in middle level
education for teachers at Medina, Indianola, and Crestview Middle Schools
The sources of evidence to evaluate the effectiveness of this strategy include: constructed responses to specific prompts completed at the end of the two-course sequence and at the end of the summer academy; results on the Teacher Efficacy Scale and Leadership Capacity Staff Survey filled out prior to and at the end of the summer academy; site visit reports written by three Columbus teachers who were not part of SAIL; and a review of action research projects designed and implemented by the eight teachers.
Proven practices in middle level education are incorporated in the SAIL program.
Site visit reports were collected across four days (6/17, 6/24, 6/27, and 6/28). Practicing teachers serving as participant observers completed an observation protocol that listed exemplary practices identified by the National Middle School Association in This We Believe (collaborative leadership, shared decision making, safe/inviting environment, high expectations, adult advocates, and family/school partnerships). The teachers were asked to note specific examples of these “principles” in action when they observed them during their visits. The three participant observers were able to document all of the proven practices. They noted that there was evidence of outstanding collaboration among the teachers and Otterbein students; that staff used lunch periods for debriefing, planning, adjusting, and adapting on a daily basis; that, while the building was old and a bit shopworn, by the end of the three weeks student work, word walls, and charts created a personalized, inviting environment; that active participation was a given, with staff regularly checking to make sure that all students were on track; that all students received adequate attention from adults because of a very favorable student-teacher ratio; and that family/school partnerships were in evidence through formal orientation and culminating celebration activities as well as informal follow-up calls when students were absent.
Teaching practices are developmentally responsive to young adolescents.
The three teacher participant-observers were also asked to look for examples of developmentally appropriate instructional practices that were identified in the This We Believe monograph (challenging, integrative, exploratory curriculum; multiple learning and teaching approaches; assessment that promotes learning; structures that support relationships and learning; school-wide efforts that foster health, wellness, and safety; and multifaceted guidance and support services). They found it easy to document that the teaching practices were developmentally responsive. Math, science, social studies, and language arts were deliberately integrated across the curriculum. Students were asked to make linkages across disciplines, to think systematically, to create their own products, and to draw conclusions. As one participant concluded, “SAIL students were asked to experience, view, think, and observe.” Assessments were as varied as the instructional delivery. They consisted of completing charts, providing written responses, constructing graphs either by hand on or the computer, and putting together summative presentations. While students worked in small groups on simulations, labs, and field trips, they developed relationships that supported learning for all group members. Through careful attention to students’ nutritional requirements (breakfast, snacks, and lunch provided) and constant reinforcement of safety rules, the staff fostered health, wellness, and safety. Guidance and support were evidenced through consistent review and reinforcement of key concepts, individual attention to encourage greater productivity and/or understanding, and advisory group activities that focused on social/emotional issues.
Teachers’ satisfaction and retention improves.
Teacher efficacy is a construct that has a direct impact on student achievement. “Self efficacy theory predicts that teachers with a high sense of efficacy work harder and persist longer even when students are difficult to teach, in part because these teachers believe in themselves and in their students” (Woolfolk, 2004, p. 370). It is noteworthy that the eight teachers’ mean efficacy scores increased between April, 2005 (the beginning of the Teacher Leadership course) and the end of June, 2005 (at the end of the summer academy).
|
Student Engagement |
Instructional Strategies |
Classroom Management |
|||
|
April |
June |
April |
June |
April |
June |
|
33 |
38.7 |
26.6 |
30 |
33.6 |
38.7 |
The Leadership Capacity Staff Survey completed in June also demonstrated growth among participants. While in April, the eight teachers indicated, on the average, that they exhibited approximately 50% of the behaviors associated with leadership on a frequent or consistent basis, by the end of July, they were exhibiting close to 75% of the behaviors. The greatest shifts occurred on items tapping “reflective practice/innovation as the norm” and “high student achievement.”
By the end of the summer academy, teachers noted in constructed responses to prompts that they felt that the staff collaboration and teacher unity were outstanding, that the curriculum planning efforts had been worth the time and effort, and that seeing kids excited, involved, and learning was revitalizing. In April, constructed responses included references to strained interpersonal relations, criticisms about the planning process, and doubts about the group’s ability to pull off a good summer program. Clearly, success eliminated tensions and reinforced the group’s faith in shared decision-making and collaborative planning.
The overall school climate and academic achievement improves.
Teachers in the three middle schools constructed and implemented action research projects in their buildings that focused on either school climate or academic achievement during the 2004-2005 academic year. At Medina Middle School, one project focused on bullying; students read a young adult novel with an anti-bullying theme and discussed it as part of their language arts curriculum. A second Medina project involved the creation of a family math night; the two math teachers who designed the event hoped to share activities with parents that could support the math curriculum. There were also two projects completed at Indianola Middle School. One involved getting 6th graders to be more reflective about their learning styles and needs. Students completed surveys and answered open-ended questions that encouraged them to think about how they learned and what resources they needed to become better learners. The second Indianola project was a school wide effort to address the issue of gangs; 600 copies of a novel about gangs were read by Indianola students and discussed in classes. Crestview Middle School instituted a mentoring program. Otterbein College students were paired with 6th graders. Mentors and mentees met for 20 minutes twice a week over a ten-week period; conversations centered around real-life problems and ways to solve them (i.e., dealing with anger, making good choices, staying out of trouble).
Strategy Two:
Expose middle school students to evidence-based teaching strategies that
improve attitudes toward learning and enhance academic achievement.
Out of 65 students who signed up for SAIL, 61 attended at least one session. The average attendance for participants was approximately 7 of the 13 days of instruction (Day 14 was the culminating celebration at Otterbein). The population target was 80. Staff was disappointed that the program did not fill; they were even more disappointed with the spotty attendance. However, there was a solid core of 30-35 students who attended regularly. Parents were contacted when students were absent. They reported that their sons or daughters had legitimate reasons to be absent: summer vacations, illness, or other obligations.
There were 38 6th graders and 23 7th graders in the program. There was a balance of males and females, with significantly more African-American students represented than any other ethnic/racial group. The average number of days absent for the population during the 2004-2005 school year was 10 days (with a range of 1-30). The modal yearly grade in both math and science courses was a B. Average achievement test scores for 6th graders were below the passing cut score of 200 (199.1 in math and 198.2 in science); average NCE’s for the 7th graders on the Metropolitan Achievement Test in mathematics and science were in the low average range (44.7 and 35.8 respectively).
While the program was under-enrolled and attendance was not optimal, there were indicators of success. The sources of evidence to evaluate the effectiveness of this strategy include: pretest and posttest data collected during the summer academy, poster presentations, and students’ verbal responses to “Oral Defense” questions.
60% of the
students will improve their attitude toward learning.
Seventeen students
were interviewed on the final day of SAIL.
In addition to specific questions related to program themes, they were
asked what they had learned and whether or not they would be willing to
participate in the future. All students interviewed were enthusiastic about
their SAIL experience. The common reason
for their positive responses was: “You get to have fun and learn at the same
time.” Students noted that they were
able to “get into” learning because they were allowed to experience rather than
to just watch, listen, or read and because they were required to “do projects.” Several noted that they appreciated the
opportunity to meet new people; others felt that the program was “something
good to do in the summer.”
60% of the students will increase their academic achievement.
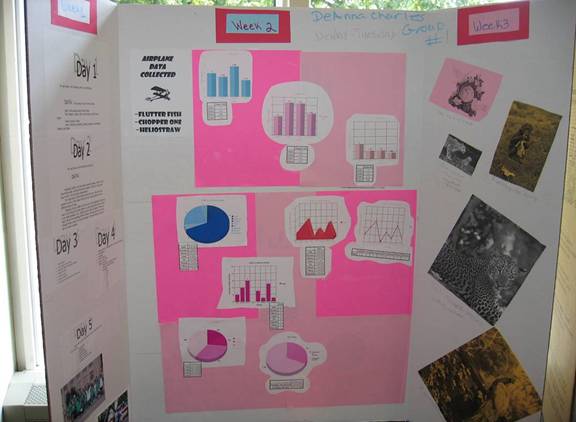
An analysis of pretest-posttest data revealed that, overall, students made worthwhile gains. On the pretest, participants were able to achieve only 35% accuracy; on the posttest, they were able to achieve 61% accuracy. Twenty of the 26 students who took the pre and posttest demonstrated growth. Perhaps more telling was the qualitative evidence provided from an examination of the student trifold board presentations and their answers to the “Oral Defense” questions. Below is one example of a student trifold:
Students were asked the following questions as part of the “Oral Defense”: What is data? How can you use data? How does data affect your world? All 17 students interviewed were able to either come up with a verbal definition of the term “data,” point to examples on the boards, or read the definition off of their boards. They were also able to refer to at least one example from the three week session that demonstrated how data could be used to measure, to classify, to modify, and to understand various types of theories, constructions and events. Answers to the question of how data affect their own world were varied and engaging.
· I will use data when I go shopping.
· I will use data to make presentations in college.
· I will use data to make decisions about which medicines are safe and which are harmful.
· I will use data to make choices.
· I will collect information from what I see, what I touch, what I smell, and what I hear.
· I realize that everyone uses data all of the time, even toddlers when they learn how to walk.
· I know that I want to be a scientist who uses data.
· I will use data so that I know more about what I am talking about.
· Data helps us to catch criminals. Otherwise, they would be on the loose.
Strategy Three:
Develop urban field experiences for pre-service teachers consistent with proven
practices in middle level education to increase their urban employment
Schools are effective field sites for pre-service middle school teachers.
Eight Otterbein methods students were assigned to the three middle schools during Spring Term, 2005. If their licensure areas matched those of SAIL teachers’ course loads, they were placed in their classrooms; if not, they were assigned to another teacher in the building but were observed by a SAIL teacher on a regular basis. The eight teachers reported that they were able to provide guidance and feedback to the pre-service teachers on a regular basis; however, it was easier for those who were actually serving as cooperating teachers to play a pivotal role in the experience. One teacher commented: “Having her placed in a classroom that was not convenient to go to was a bit of a stumbling block.”
Without question, the summer academy was a profound urban field experience for the seven Otterbein students who were able to participate. Representative comments made in response to an open-ended question about positive aspects of the experience included the following: “One thing I thought was great was the fact that all of the pre-service and in-service teachers truly clicked and taught each other things”; “We really came together as a team”; and “I enjoyed working with the kids in this setting.” It is noteworthy that several major “pieces” of the curriculum (assessment tools, forensics lab, mystery simulation, and COSI visit packet) were prepared and executed by the Otterbein students. As these methods students move into student teaching, they will do so with enhanced skills. Their increased sense of confidence is reflected in their responses to items on the Teacher Efficacy Scale prior to and at the end of SAIL III:
|
Student Engagement |
Instructional Strategies |
Classroom Management |
|||
|
April |
June |
April |
June |
April |
June |
|
31.6 |
36.2 |
23.7 |
25.6 |
31 |
33.6 |
At least 40% of the
pre-service teachers will choose employment in urban setting.
By the end of SAIL III, five of the eight Otterbein Students indicated a preference for teaching in urban schools. The following e-mail sent to Dr. Ross, Project Director, demonstrates the impact of SAIL on one of the Otterbein participants:
I just wanted to say thank you for giving me the opportunity to be involved with SAIL! I believe that the experience has helped me grow into the teacher I want to be some day. I also have a passion to teach in a Columbus school now (who would have thought?). I think working with urban middle schools has really opened my eyes and has challenged me to meet the academic and developmental needs of all the students. Working with children from the inner city has really touched me, and I hope and want to continue to work with the urban schools if I am given the chance! Thanks again!
Strategy Four: Fund future professional development.
Future funding is obtained to have broader impact within
schools and to train SAIL mentors to continue program post-funding.
Future funding for professional development has been obtained. Columbus Public Schools and its higher education partners were awarded a $9 million dollar Teacher Quality Enhancement grant. The program described in the original grant proposal includes professional development opportunities that are modeled after SAIL.
In addition, Project GRAD, Columbus Public Schools, Otterbein College, The Ohio State University, and Columbus State Community College collaborated on a GEAR UP proposal that was submitted in March, 2005. Included in the project design is funding for professional development that would support middle school teachers and other school personnel. While the focus is on improving the graduation and college attendance rates of adolescents in the cohort, there is significant attention paid to building the capacity to be able to provide a high quality educational experience for urban middle and high school students through delivery of accessible, context-embedded staff development.